eCommerce Performance Analytics 101

Introduction
E-commerce performance analytics refers to the process of collecting, analyzing, and interpreting data generated by eCommerce websites or platforms to gain insights into customer behavior and make informed business decisions. This can include metrics such as website traffic, sales, conversion rates, customer demographics, and product performance. The details gained from eCommerce analytics can be used to optimize the customer experience, improve marketing and sales strategies, and importantly, increase profitability.
If you wanna notch up great success, taking advantage of eCommerce analytics is a must. Definitely!
You might find it overwhelming at first, but we will together unlock key points that you, as a store owner, should know like the back of your hand.
Why Do Performance Analytics Matter for Your eCommerce Store?
Analytics matter to you as they provide valuable insights into key aspects of your business, including customer behavior, website performance, and sales trends. Online merchants make use of these points to make major decisions, including:
- Improving the customer experience: Analytics can reveal customer pain points and preferences, allowing store owners to make data-driven decisions to improve the customer shopping journey.
- Increasing conversions and sales: By analyzing key metrics such as conversion rates and average order value (AOV), merchants can identify areas for improvement and optimize their eCommerce strategy to boost sales.
- Streamlining operations: Analytics provide insights into which products are selling well and which are underperforming, allowing you to make wise decisions about inventory management and product offers.
- Optimizing marketing efforts: Analytics help store owners understand the effectiveness of different marketing channels and campaigns. Thus, you can allocate your marketing budget more effectively and target the right group.
- Making data-driven decisions: By regularly tracking key metrics, store owners can make informed decisions about their eCommerce strategy, rather than relying on gut instincts or assumptions.
5 Types of eCommerce Performance Analytics

There are several types of eCommerce analytics that you should be familiar with. Here are tried-and-true kinds to assess business performance.
- Website analytics: Tracks website traffic, user behavior, and conversion rates. This type of analytics helps store owners understand how customers interact with their website and identify room for improvement.
- Marketing analytics: Analyzes the performance of marketing campaigns, including email marketing, social media, and paid advertising. You can easily measure the ROIs of your marketing efforts before allocating your marketing budget.
- Customer analytics: Analyzes customer data, including demographics, purchase history, customer lifetime value, and so on. This type of analytics helps store owners understand their customers to map out future campaign strategies.
- Sales analytics: Tracks sales data, including revenue, AOV, and product performance. Thanks to these data points, online merchants will break down more statistics about the overall performance of their e-stores.
- Inventory analytics: Tracks inventory levels, sales data, and order fulfillment. These reports uncover sales demands, how your collections perform, forecast inventory needs, and optimize pricing.
What Are Key Metrics to Evaluate The Success of eCommerce stores?
Based on the popular types of eCommerce performance analytics, there are some key metrics that you should understand when stepping into the online retail industry. Let's take a look at the following table and check if you master all of them.
| Key metric | What is it? |
|---|---|
| Website traffic | The number of visitors to a website. This metric can give an understanding of the store's reach and visibility. |
| Bounce rate | The percentage of visitors who land on a page and leave without performing any action. This metric can provide insight into the user experience and whether visitors are finding what they are looking for. |
| Conversion rate | The percentage of website visitors who make a purchase. This metric can provide insight into how well the store is converting website traffic into sales. |
| Average Order Value (AOV) | The average revenue generated by a customer during each visit to an online retailer. This metric can help to understand the profitability of the store's products. |
| Customer Acquisition Cost (CAC) | The cost of acquiring a new customer, including marketing and advertising expenses. |
| Customer Lifetime Value (CLV) | The total amount of money a customer is expected to spend with your business, or on your products, over the course of an average business relationship. |
| Cart Abandonment | Rate The percentage of visitors who add items to their cart but do not complete the purchase. This metric can give insights into potential reasons for abandoned carts, so you can come up with actionable tasks to win back these customers. |
Take a deep breath, and have a few sips of your coffee as we now walk into how to use eCommerce analytics from top to toe.
eCommerce Performance Analytics Best Practices
You know what kinds of reports you should check. You know fundamental metrics you should keep an eye on. But how will you know if your business is growing or not? What should you improve? What should you maintain? Here are some best practices for using eCommerce analytics.
Define Goals & KPIs
Clearly define the business's goals and the key performance indicators (KPIs) that you will be using to measure progress toward those goals. This will ensure that the right metrics are being tracked and analyzed.
Choosing your KPIs starts with clearly expressing your goals and understanding which areas of the company have an influence on those goals. Of course, KPIs for eCommerce may and should fluctuate depending on whether your aims are to increase sales, optimize marketing, or enhance customer service. Here is an example for you.
| Goal | KPI |
|---|---|
| Boost sales by 10% in the next quarter | Site traffic increases by X% |
| Conversion rate doubles/triples in the next quarter | |
| Daily sales experience a rise of X% |
Use A Variety of Analytics Tools
Utilize a variety of analytics tools to gain a comprehensive understanding of your eCommerce store's performance. This may include website analytics tools, email marketing automation platforms, and CRM software.
We will discuss this later in the article.
Track Key Metrics Regularly
Regularly track key metrics such as website traffic, conversion rates, and customer lifetime value to stay informed about the store's performance and identify trends over time.
Use Segmentation
Segment data to gain a more in-depth understanding of specific customer groups, such as those who have made a purchase, or those who have abandoned their cart.

It is important to gain a deeper understanding of your customers’ traits and behaviors, in other words, a customer persona. Some points you should try to find out are:
- Demographics (age, gender, and so on)
- Where are they located?
- Which channels do they use to interact with your business?
- Which brands/products/categories are most interesting to them?
Analyze Customer Behavior
Analyze customer behavior to understand their preferences and pain points, and use this information to inform decisions about the customer experience.
Test & Iterate
Use data and insights to inform decisions, and continually test and iterate on the eCommerce strategy. Also, don't forget to communicate results and insights from the analytics to relevant stakeholders, including the leadership team and marketing department to change strategy if needed.
Which eCommerce Analytical Tools for Shopify Stores?
It is impossible for you to track everything manually, right? Thanks to the advances in technology, online business owners and marketers now track key metrics within a few minutes. And if you’re running your business on Shopify, we introduce to you several eCommerce analytical tools that are compatible with your store, which will help you a lot. Let's find out more.
Shopify Analytics
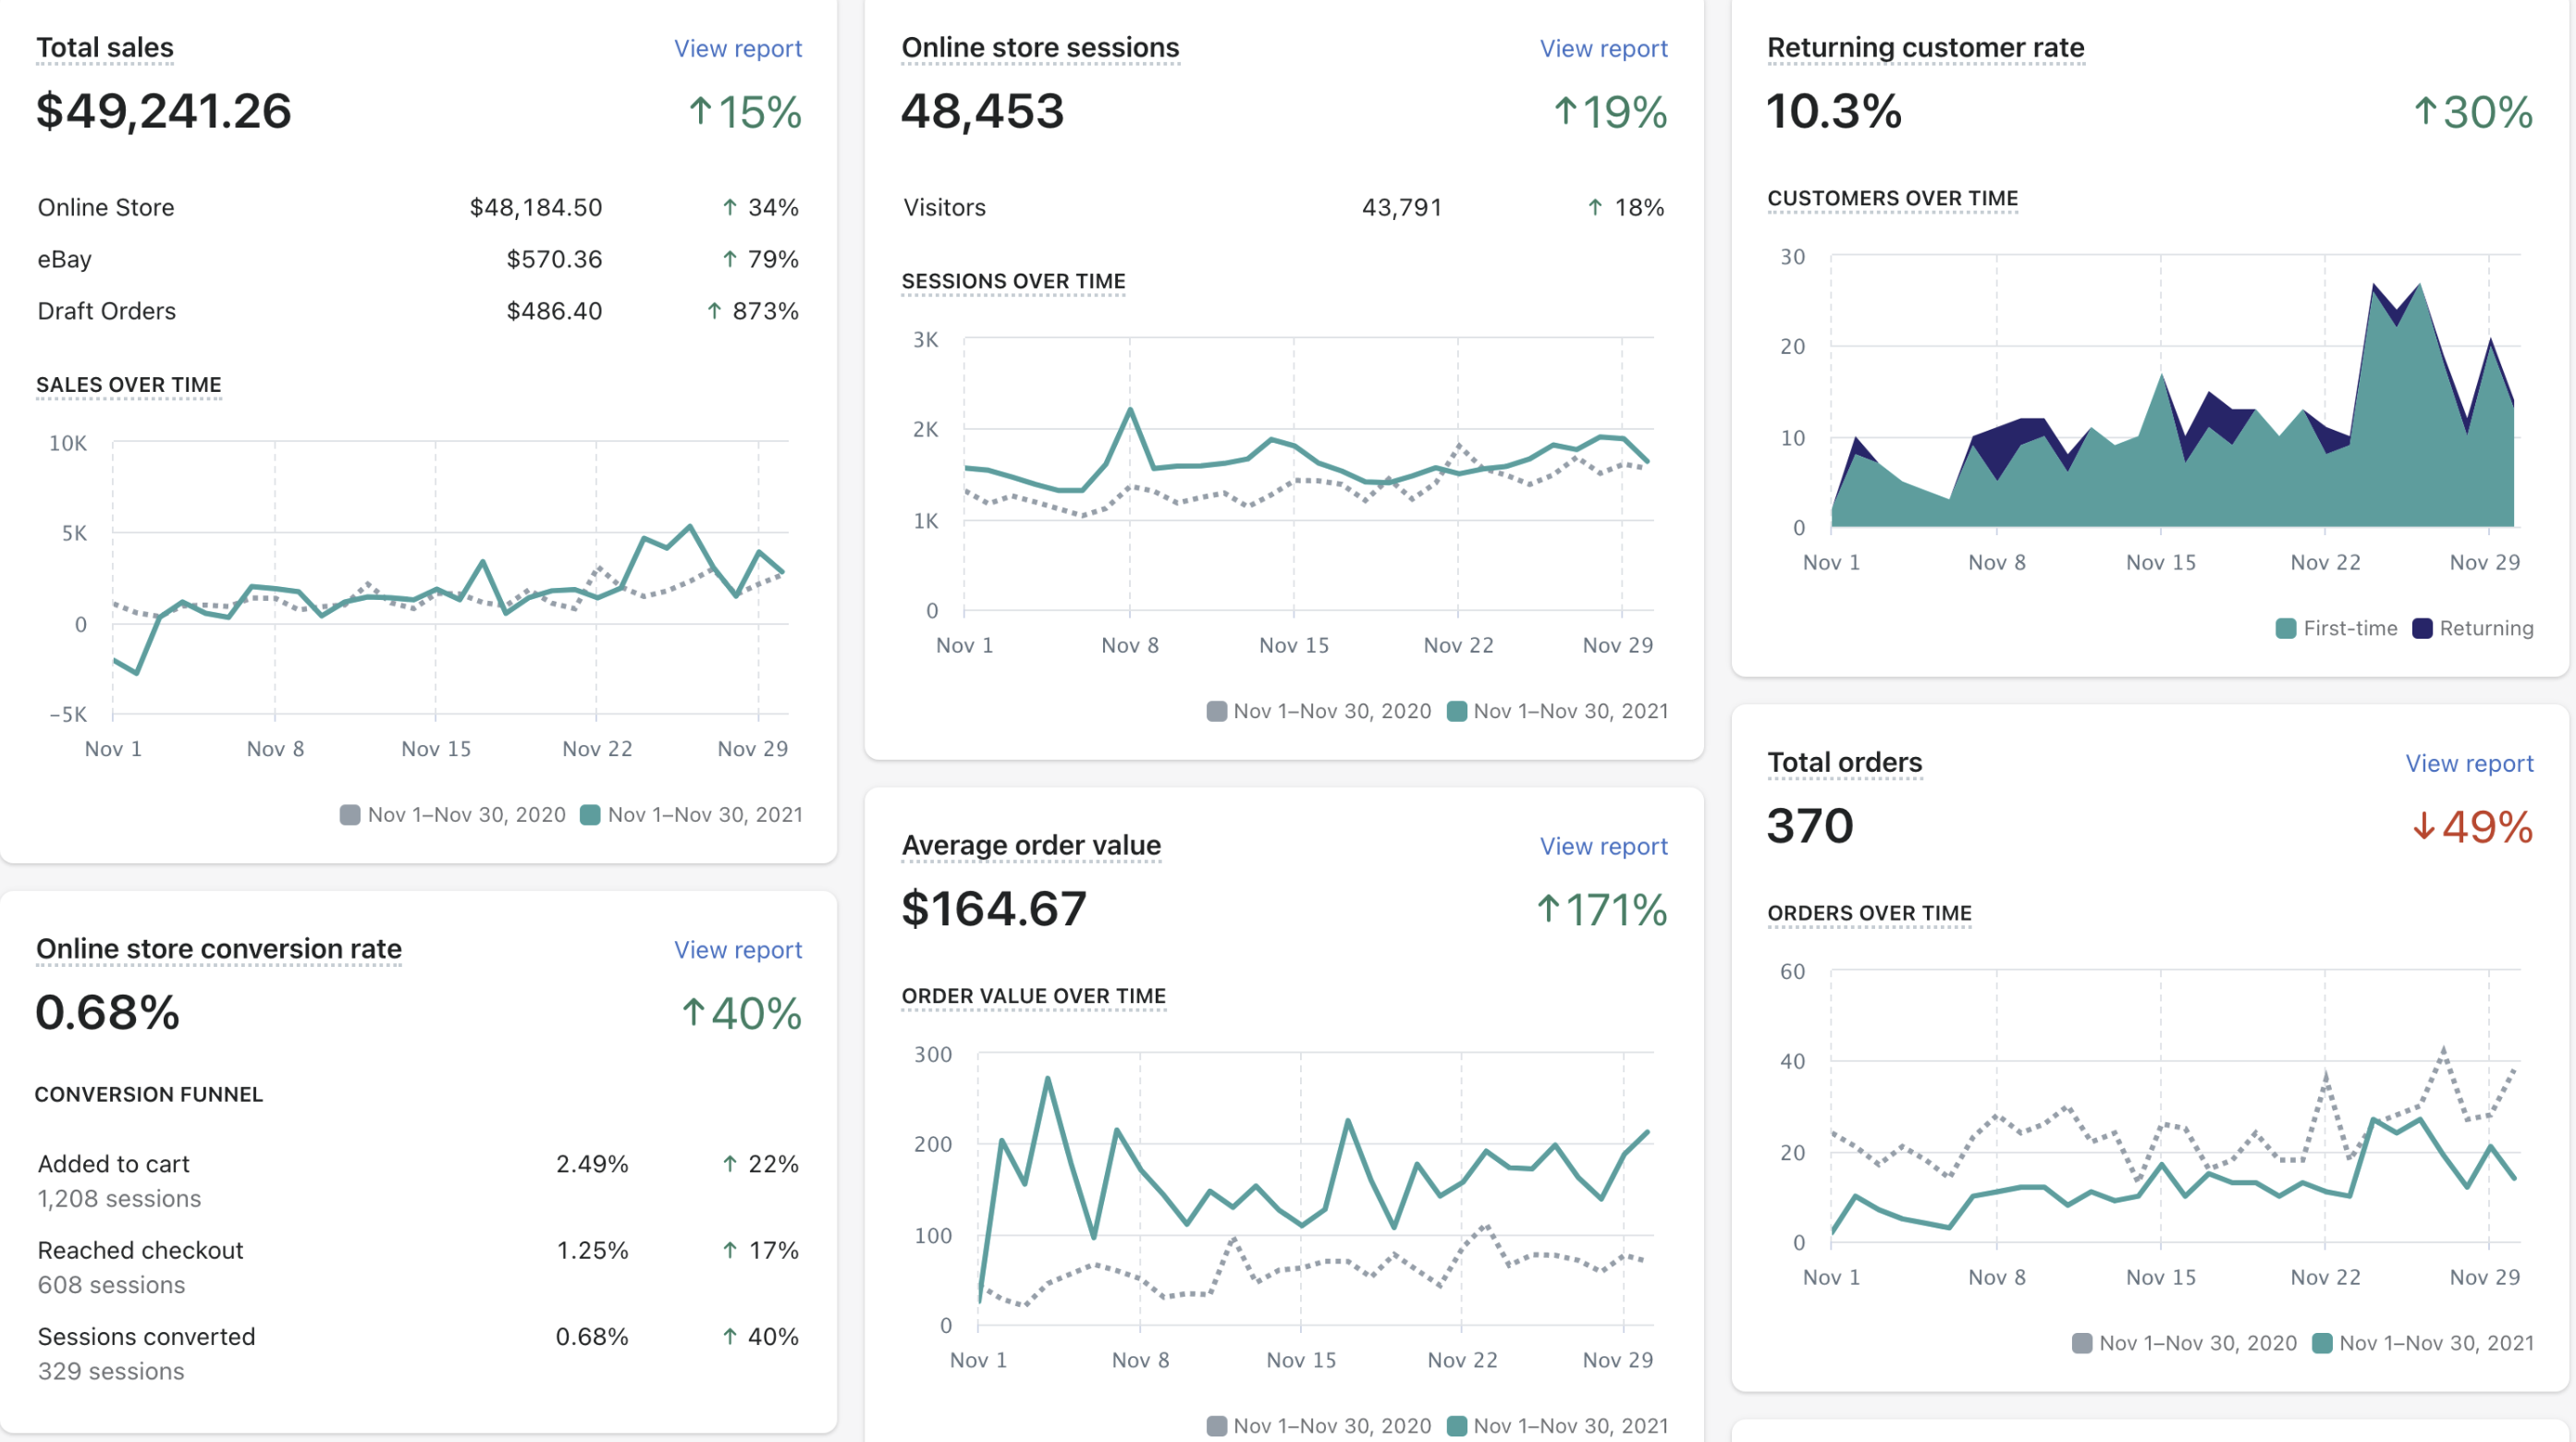
Shopify's built-in analytics tool provides an overview of store performance, including sales, traffic, and conversion rates.
 Shopify analytics dashboard (Source: Search Engine Journal)
The Analytics page and essential financial information are available to everyone. You may use Live View if you run an online store. More reports are available if your store is on the Basic Shopify plan or higher.
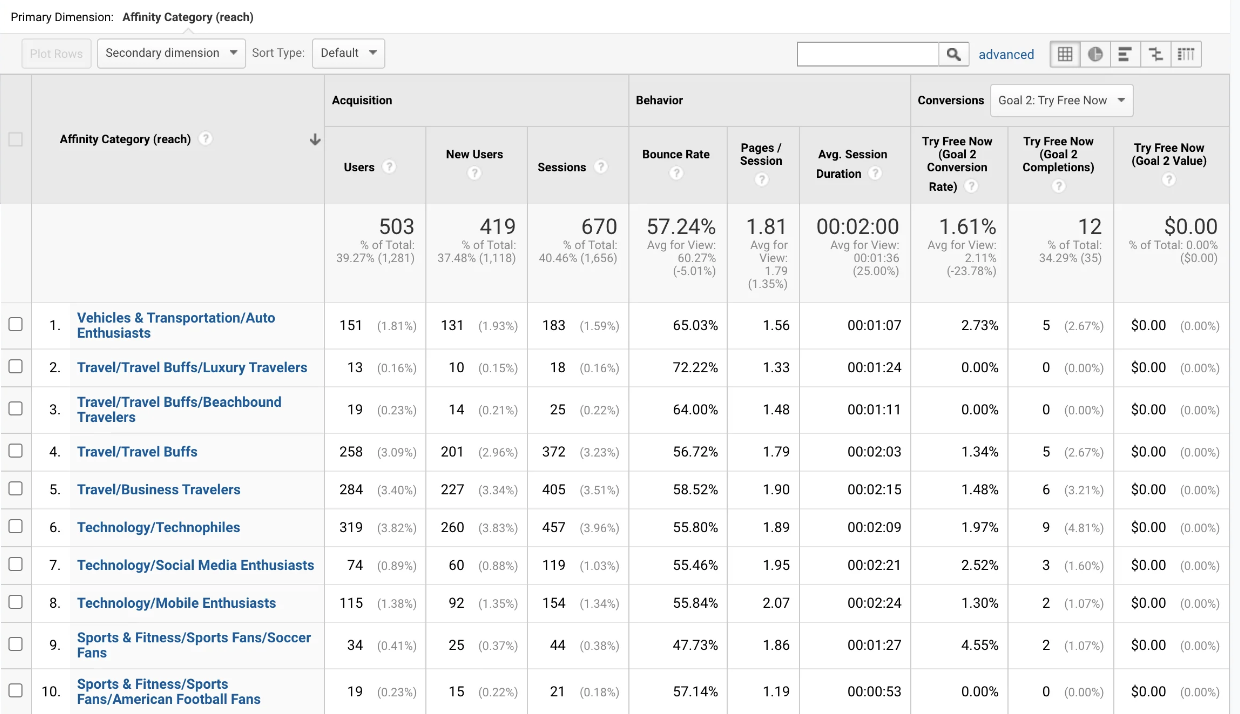
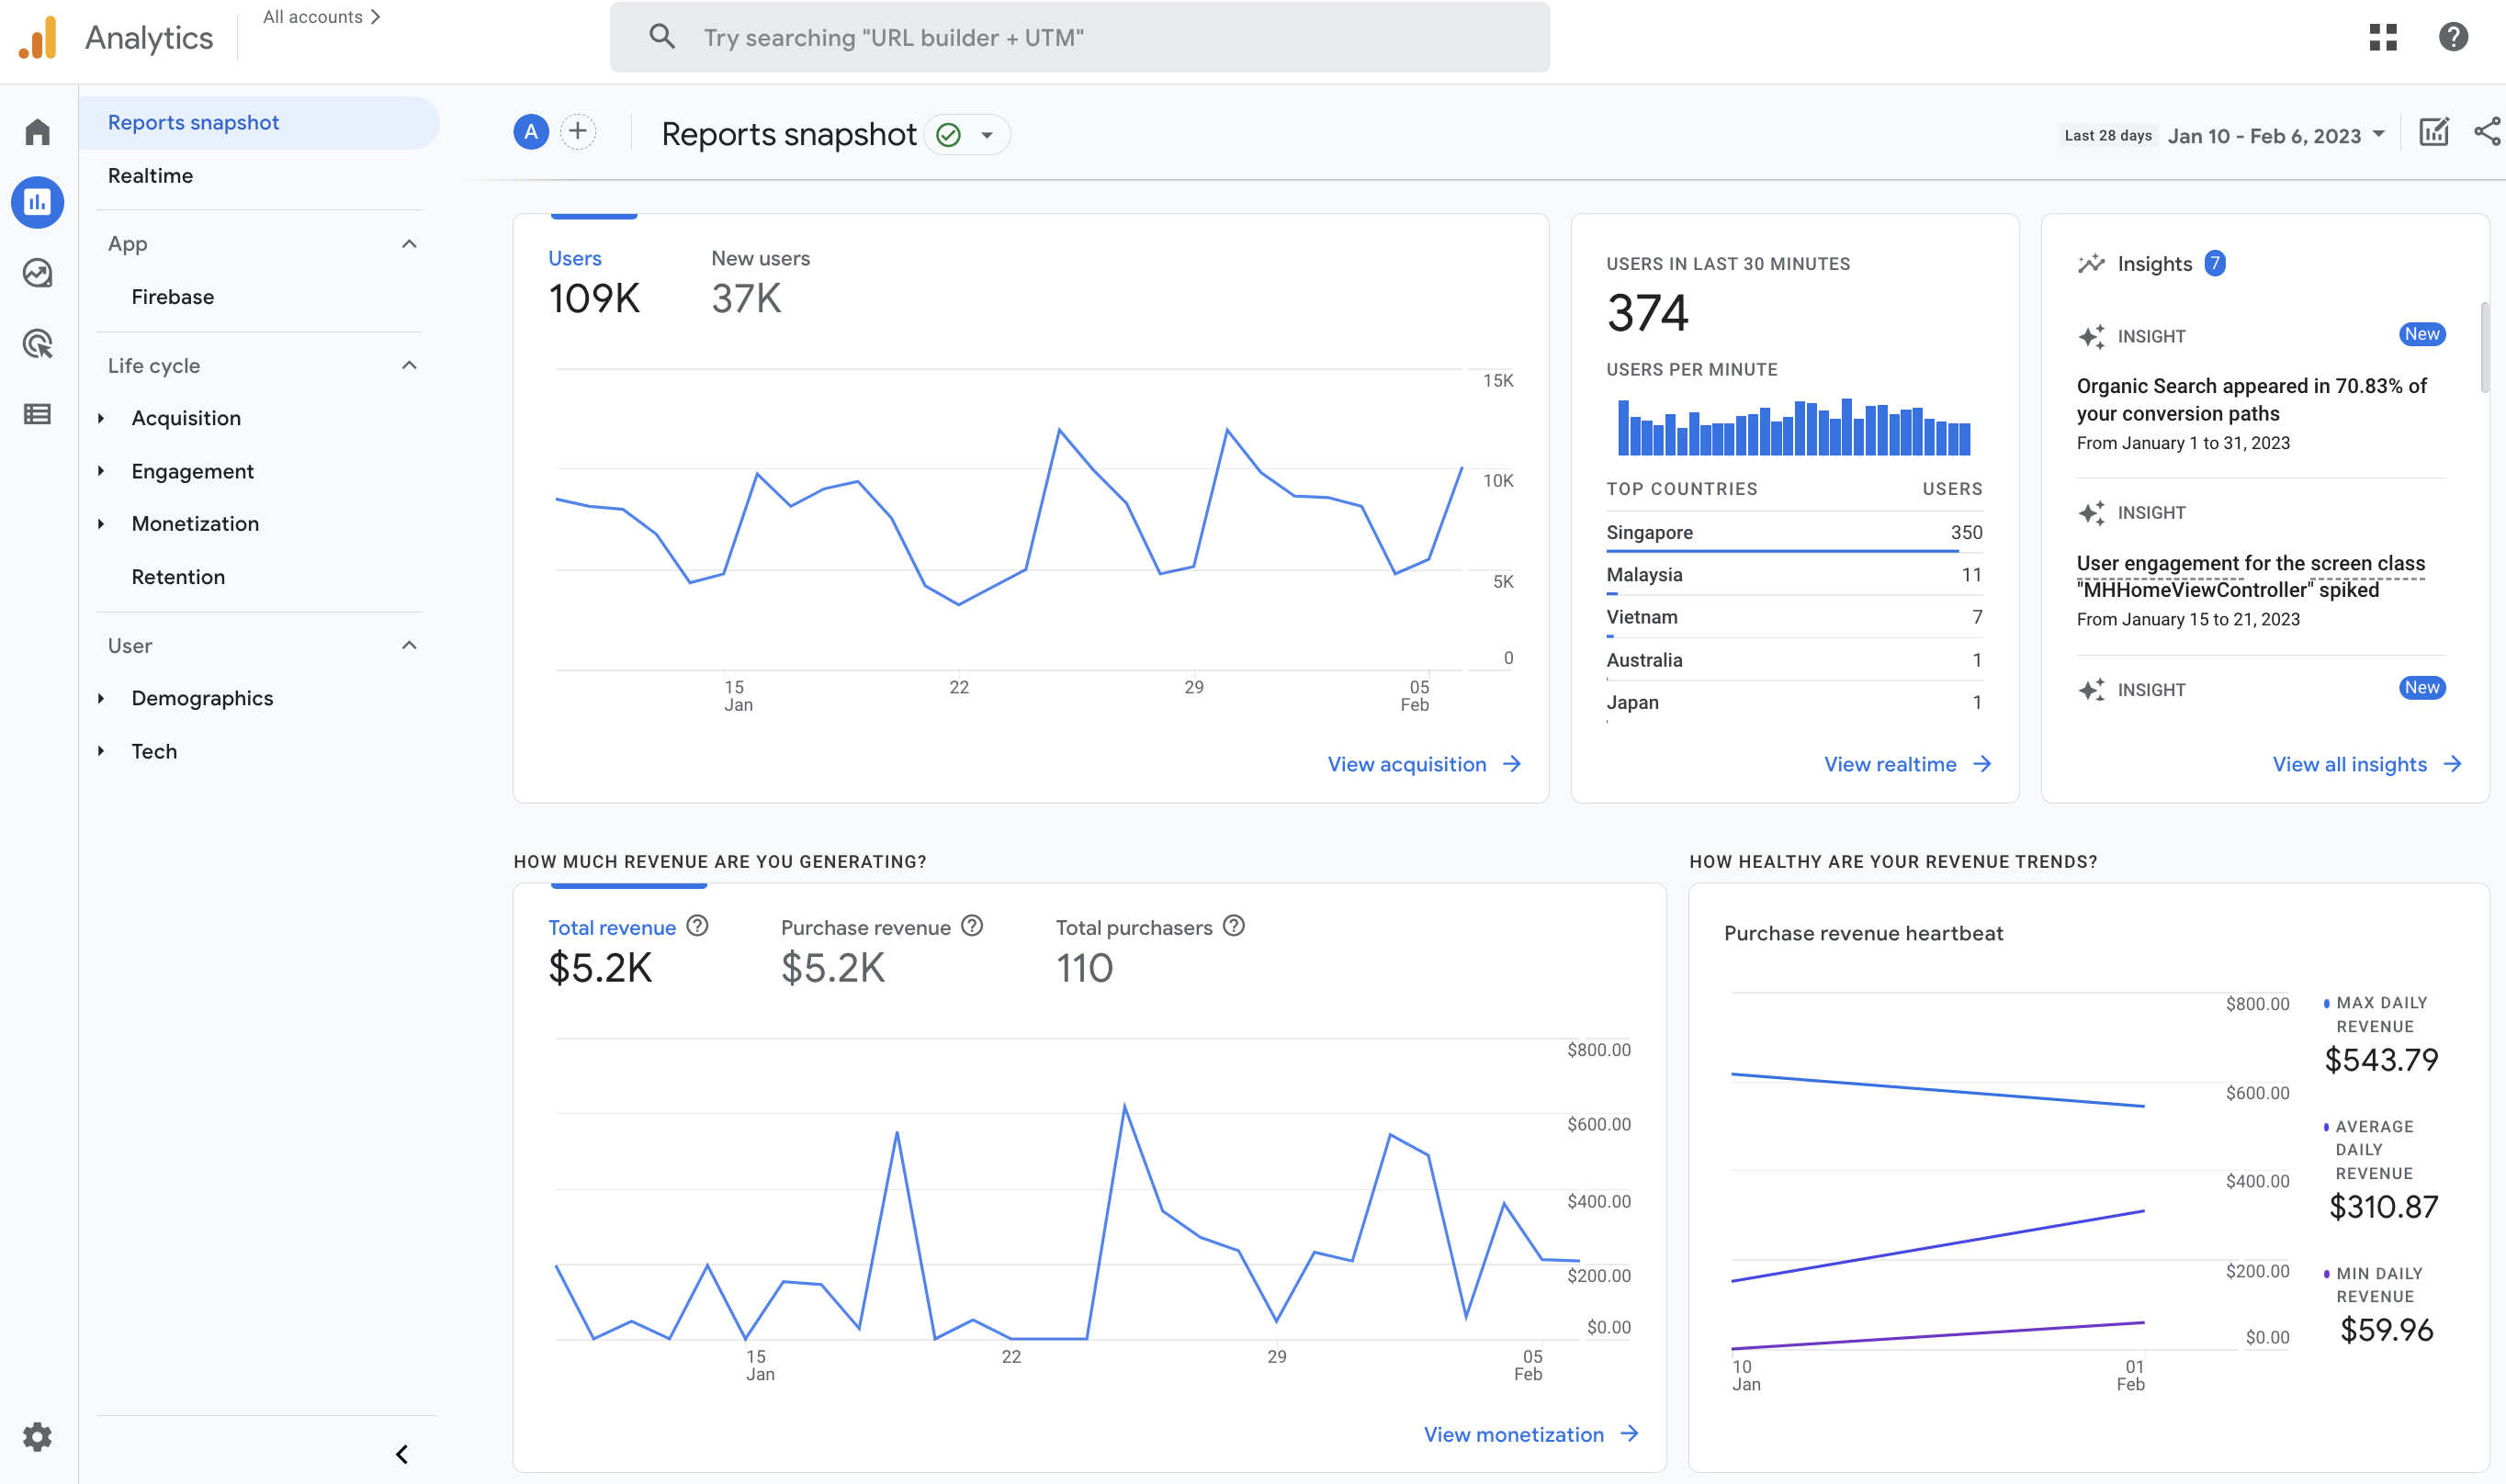
Google Analytics 4

Google Analytics is no longer a new thing to all of us, right? As some of you know, Universal Analytics will stop processing data on July 1, 2023. Instead, Google has rolled out a new version called Google Analytics 4, and you should come to make friends with it now.
Learn more: Introduction to Google Analytics
Collection & Search Analytics
Based on Analytics data, you may deliver a more seamless shopping experience for your consumers while also improving virtual touch-points and meeting sales targets.

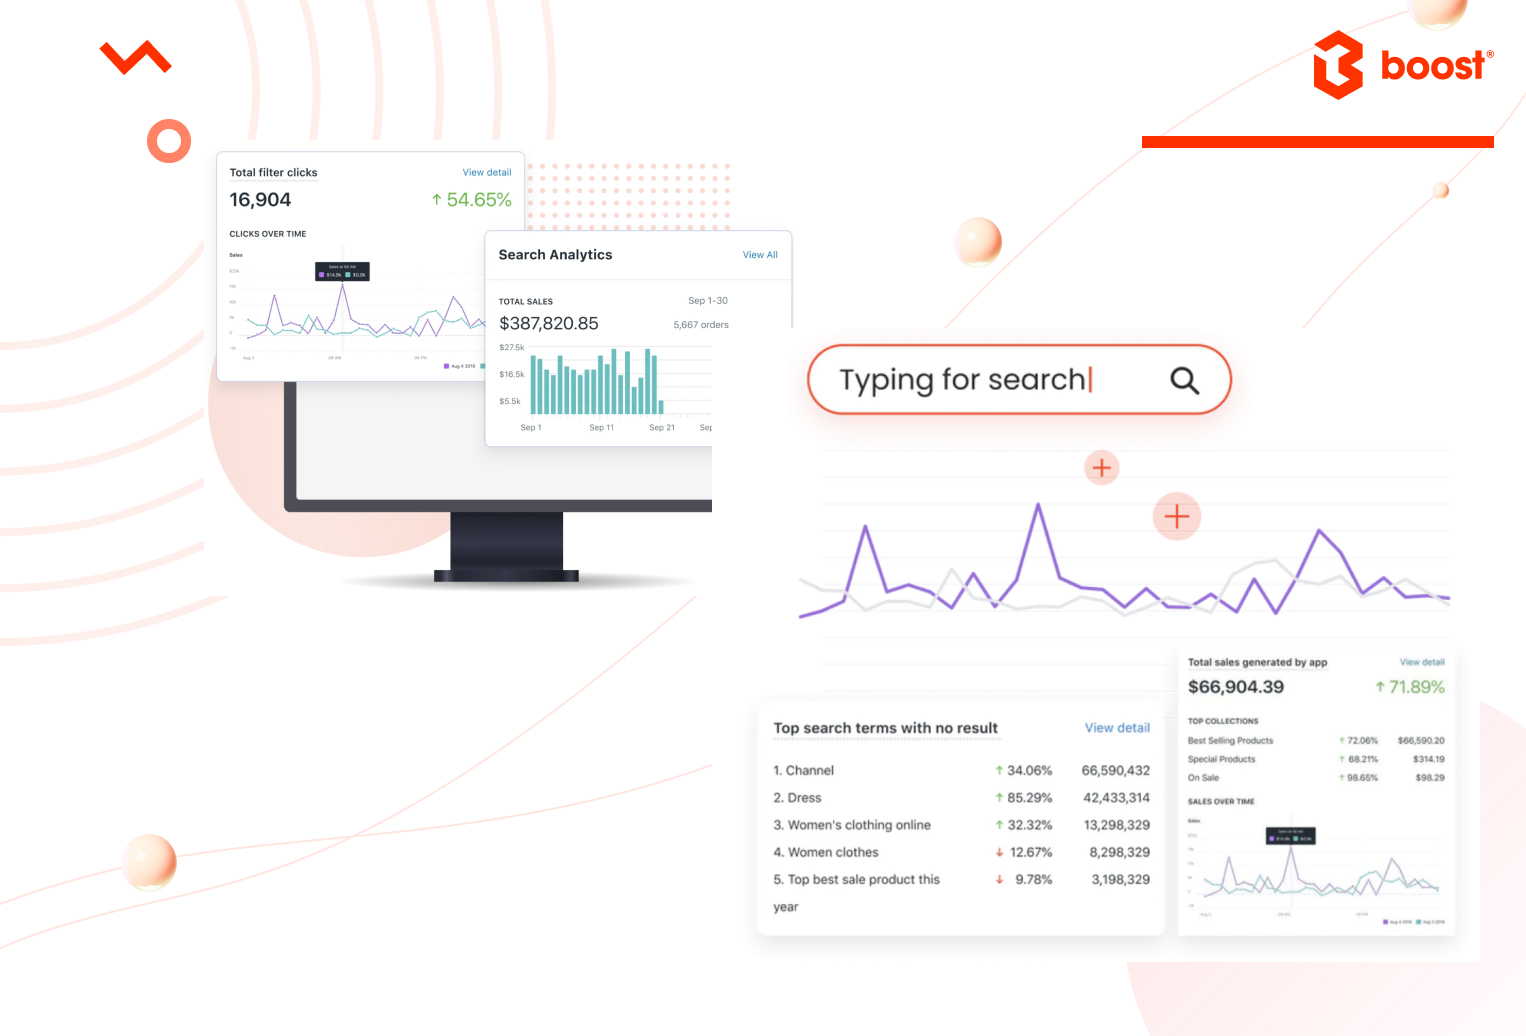
You can enhance your Shopify search thanks to this all-in-one report. (Source: Boost Commerce)
The Analytics function explores your eCommerce site for all visitors that traverse the shopping environment. There will be 3 important reports on the Analytics Overview dashboard: Collections Analytics, Search Analytics, and Total Sales by Filter & Search. Analytics, as a behavioral monitoring tool, provides a comprehensive picture of your consumers' search behavior. Every shopper's activity on your sites gives valuable insight into their behavior, from the most prevalent search queries to the most selected filter choices.
Common Myths About eCommerce Performance Analysis
Analyzing data is a challenging task that will not be done in 1 or 2 days. It will take you lots of time and that is a continuous process: planning - executing - testing - optimizing.
However, some people misunderstand the progress leading to wrongly interpreting the data.
- Data speaks for itself: While data can provide valuable insights, it is a must to interpret it correctly and understand the context behind it. Statistics are only valuable when they’re used to inform business decisions.
- More data is always better: Having access to too much data can lead to analysis paralysis. This can make it difficult to identify the most important metrics to focus on. It is more important to focus on the right data that is relevant to the business goals.
- Analytics is only for large businesses: Small eCommerce businesses can also benefit from analytics and use the insights to optimize their operations and drive growth.
- All analytics tools are the same: Different analytics tools have different features and capabilities. It is important to choose the right tool for the business's specific needs and goals.
- Analytics is a one-time setup: Analytics should be an ongoing process, regularly tracking key metrics and making data-driven decisions to improve the eCommerce strategy.
- Analytics can't help with customer experience: Analytics provide in-depth insights into customer behavior, preferences, and pain points, allowing eCommerce businesses to take action to improve the customer experience.
By being aware of these common myths, eCommerce store owners like you can make the most of their analytics, and use the insights to drive growth and success.
Wrapping Up
So there you have it: all you need to know about eCommerce analytics and why they are crucial to your business. You may make wiser decisions that will propel your business ahead and, eventually, boost your bottom line by utilizing data. This is the only way to evaluate what is working effectively and what needs changing. Everything is your assumption unless it is measured correctly.